
The VfM analysis compares the relative merits of PPP procurement against one or more other procurement routes, usually traditional public finance. This can be done using quantitative analysis, qualitative analysis, or both. Some frameworks focus on quantitative analysis, requiring a comparison of the cost of the PPP against the cost of traditional delivery, which is represented by a Public Sector Comparator (PSC) cost model. Other frameworks rely on qualitative analysis or on a combination of the two approaches.
The analysis begins with the selection of the procurement routes to be compared. The standard exercise involves comparing the PPP project with the traditional procurement, in which the government designs, finances, builds the asset and operates the project either, directly or through singular contracts.[46]
The common methods of quantitative and qualitative VfM analysis are described below.
16.2.1 Quantitative VfM Analysis
The first step for conducting a quantitative VfM assessment is to produce a raw PSC. This refers to the estimate of the whole-life or baseline costs of the project from the government’s perspective, if the project were to be implemented through a traditional procurement route and taking into account any revenues that would be received by government in this circumstance. A frequent assumption is that these costs and revenues should reflect the achievement of the same results expected by the private sector under the PPP contract. The PSC is usually developed by documenting the costs and revenues in a spreadsheet model from the government’s perspective.
The most common source of this data is the base case produced as a part of the commercial feasibility exercise. The base line costs are likely to have the following outline in most PPP projects (figure 4.4).
FIGURE 4. 4: Example of the Baseline Project Costs
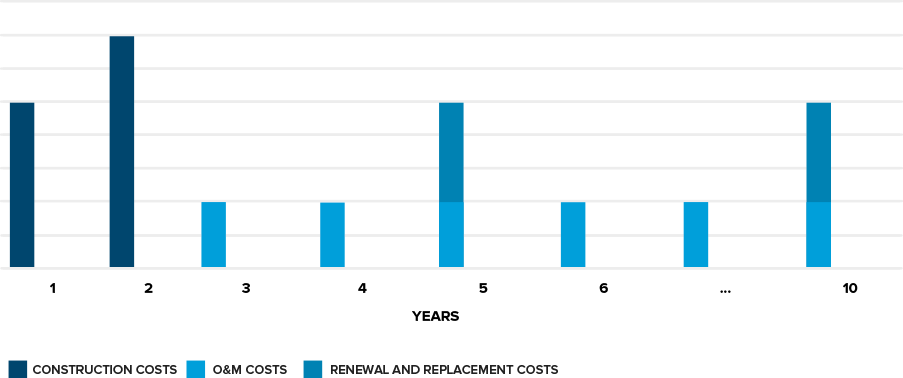
Note: O&M= operation and maintenance.
It is important that all the efficiency gains generated by the private sector involvement, which may have been considered in the base line costs as a part of the commercial feasibility exercise (see section 8), are excluded at this point because, in most cases, the PSC reflects direct delivery by the government.
It is important to note that the PSC will be further used as a benchmark against which the PPP fiscal costs will be measured, in search of efficiency gains due to optimum risk transfer. Therefore, all non-fiscal revenues (such as user-paid revenues) considered in the PPP option should be included in the PSC calculations because the raw PSC reflects the net fiscal impact of the project (costs less revenues).
If, however, there are reasons to believe the revenues generated by a traditionally procured project are different (generally smaller), the values included in the PSC calculations should reflect this adjustment, representing the potential revenue generated by the traditionally procured project. One example is when the private sector can access additional revenues by property development or advertising, which cannot be easily done by governments. In this case, the PSC should not include the costs or revenues associated with property development or advertising, even though these costs and revenues are included in the financial model of the project company. Figure 4.5 illustrates this deduction from the original base line costs.
FIGURE 4. 5: Example of the Net Baseline Project Costs (total costs deducting project’s revenues)
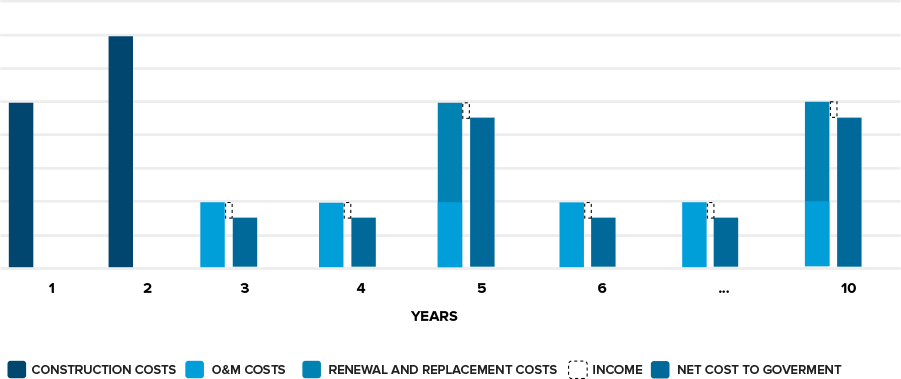
Note: O&M= operation and maintenance.
The second step for conducting a quantitative VfM analysis is to turn the raw PSC into an adjusted PSC to permit a fair comparison. The adjusted PSC typically involves changing the costs so they incorporate the risks that the government retains in the traditional procurement (and would be transferred to the private partner under a PPP model). Other adjustments to PSC include allowing for the difference in socio-economic benefits and neutralizing any cost differences which do not reflect true efficiency differences.
The risk adjustment is justified because the two cash flows need to reflect, as far as possible, identical risk profiles from the government’s perspective. For example, if the construction risk is transferred to the private partner under the proposed PPP scheme, the PSC needs to reflect the risks related to bearing the construction risk, and the economic consequences of possible construction cost overruns should be added to the PSC.
Note that from the perspective of the private sector, the baseline costs will already incorporate, to some extent, an evaluation of risks. Therefore, the adjustment for risk of the PSC should be concerned with potential cost variations associated with the traditional procurement route on top of the risks already considered as a part of the commercial feasibility exercise.
The probability of cost overruns can be estimated based on historical data on previous public construction contracts, operation and maintenance (O&M) contracts, and renewal and replacement contracts. Also, on occasions when no such data is available, the experience of technical teams can help to value such cost overruns (this is generally a percentage of deviation over the baseline project costs). All the assumptions and data sources should be extensively documented to create an audit trail.
Highly experienced project teams may use more sophisticated processes to estimate such costs overruns through probabilistic analysis, such as Monte Carlo Simulations[47].
Naturally, this exercise depends on the proposed risk allocation scheme as a part of the preliminary contract structure because only the risks transferred to private parties in the PPP alternative should be used in the PSC adjustment[48].
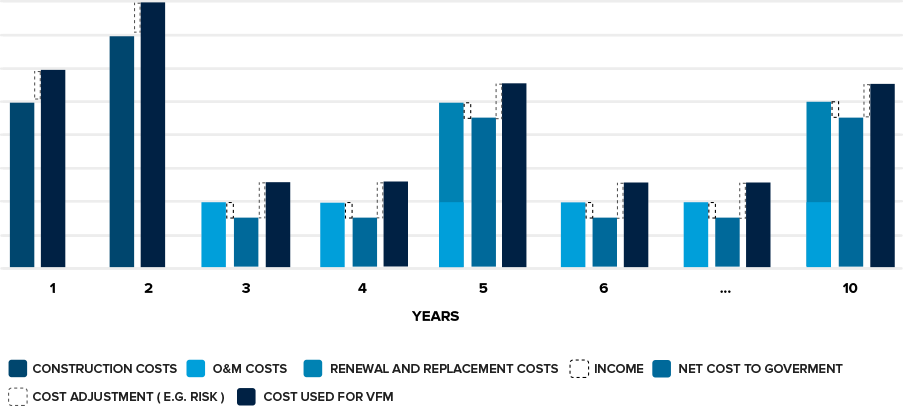
Another adjustment that is sometimes made to the PSC to “level the playing field” is the incorporation of differences in social and economic benefits of the two procurement routes. In fact, the comparison between the two procuring alternatives generally assumes that the “project outcomes” in both alternatives are the same, which would make such an adjustment unnecessary. However, the choice of procurement route may alter the socio-economic consequences of the project. The most common example is project delays[49]. Under the PPP alternative, delays in construction might be less likely. Thus, the socio-economic cost of delays in construction (under traditional delivery) should be incorporated in the PSC so as to introduce an important advantage of the PPP model. In this case, a socio-economic cost of the absence of service (in monetary terms), during probable delays, needs to be added and the additional cost associated with this risk augments the PSC. See figure 4.6.
Although this is not a very common adjustment, some countries have lately focused on differences in socio-economic benefits as a key aspect in VfM assessments. France, for example, has considered the higher benefit associated with expected earlier completion of a PPP project in the VfM analysis, in part to offset the implications of faster capital expenditures. This benefit has been approximated by using the total project cost as a proxy for project benefits and calculating the value of bringing forward that benefit by x years at the social discount rate.
Another example of socio-economic differences being incorporated into the VfM analysis can be found in New Zealand’s PPP program. The country’s Guidance for Public Private Partnerships states that dollar values should be assigned for the following differences between PPPs and traditional procurement, as far as possible.
- Greater user benefits; and
- Greater community benefits, that is, for the benefit of the surrounding community.
FIGURE 4. 6: Example of the PSC Project Costs (including cost adjustments)
A third type of adjustment is normally referred to as “competitive neutrality adjustment”. Some countries adjust the PSC to neutralize the cost advantages of the implementation of a project by a public body that are only apparent, and do not reflect effective efficiency gains. The most common adjustment is the addition to the PSC of a tax effect, simulating the same tax regime of the private partner in a traditionally procured project or reducing the fiscal impact of PPPs to deduce the tax effects.
Once the adjusted PSC is produced, the third step of the quantitative VfM analysis is to estimate the costs of the PPP project. This data is mostly an output of the commercial feasibility assessment and has been estimated for the affordability exercise. Since the non-fiscal revenues have been deducted from the PSC estimates, the cost to be considered in the analysis is the estimated cost for the government, regardless of the payment from users.
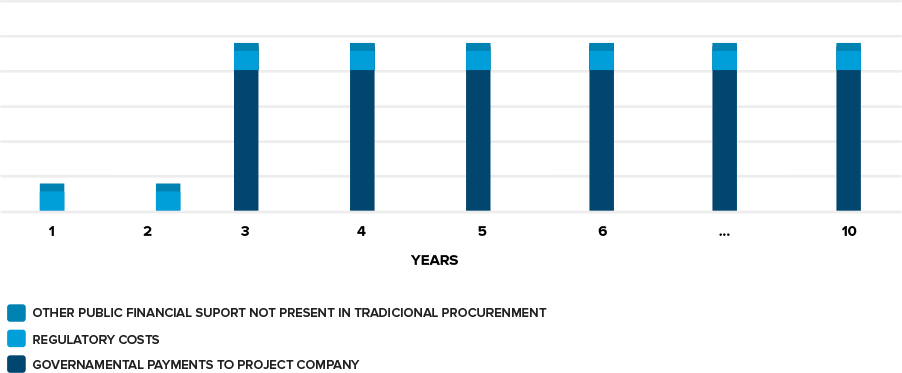
As has been described in section 6.6, the governmental payments can assume different triggers and profiles over time, depending on the payment mechanism designed. However, a common payment structure produces constant availability payments throughout the contract once the project is operational. See figure 4.7.
The fiscal impacts considered at the estimation of the costs of the PPP alternative should also be adjusted for the cost to the government of project management and transaction implementation. This should be included, since the regulatory costs may differ between a PPP and traditional public procurement. So the cost regarding agencies’ extra staff required or independent construction certifiers need to be added to PPP costs whenever they are exclusively related to the PPP alternative.
A further adjustment that needs to be taken into consideration relates to other types of public financial support that are eventually considered. Loans by a state-owned enterprise (SOE) that subsidizes interest rates that would only be possible through the PPP alternative, for example, might represent an indirect cost to taxpayers that must be considered to produce a fair analysis.
FIGURE 4. 7: Example of Governmental Payments to PPP’s
After obtaining two different cost options, the VfM analysis can now move to the fourth step, which is to achieve a comparable value from two cost structures with different time profiles. The correct methodology to apply is the comparison of the Net Present Value of each alternative, applying a discount rate to the projected alternative costs.[50]
As is the case with the discount rate for Cost-Benefit Analysis, introduced in chapter 3, the discount rate to be used in VfM analysis has been developed differently around the world. Several approaches are used in different countries, with the most common cases listed below.
- Use of the opportunity cost of government funds (or the government risk-free borrowing rate) for both the PPP and the PSC cost structure. The justification is that the decision for a PPP or traditional procurement is a governmental investment decision and, as such, its “cost of money” is the parameter used to choose the optimum time schedule for payments;
- Use of a particular rate for each project corresponding to the degree of project risk; this is done on the grounds that the cost of capital or discount rate is specific to each project and is a function of the project’s risks. The justification is that the payments of each specific project are subject to different risk profiles (from the perspective of the paying authority). So, different projects might demand a different assessment of the preferred payment structure or implementation strategy (PPP or traditional procurement); and
- Use of the social time preference rate as the standard real discount rate for both the PPP and the PSC. Social time preference is defined as the value that society assigns to present, as opposed to future, consumption[51]. The justification is that the risk-free borrowing rate of countries is used as a macroeconomic regulation mechanism. The choice between different payment schedules should be made considering the society’s preference for present consumption, instead of the project or government borrowing rate[52].
Since the discount rate directly affects the conclusion of the VfM assessment, its choice should be made carefully and be clearly justified. A consistent methodology should be used, rather than making inconsistent decisions for different projects[53].
Once the PSC and PPP cost alternatives have each been reduced to one Net Present Value, the fifth step is to indicate which one represents the best alternative to implement the project. The PPP is said to offer a better Value for Money when the costs are lower than the PSC, as indicated in figure 4.8 and the following equation:
FIGURE 4. 8: Simplified Value for Money Example
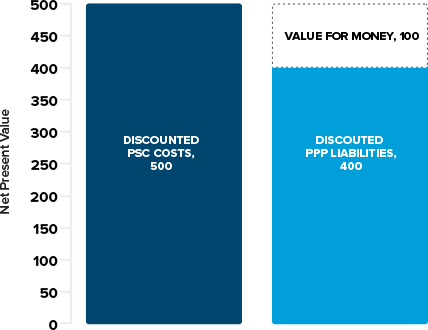
Note: PSC= public sector comparator.
The calculation formula can be simplified as follows:
![]()
Where:
VfM = Value for Money
YCt = Yearly cost of the PPP scheme in year t (for instance, availability payments)
ARCt = Adjustment for regulatory costs
r = Discount rate
CCt = Construction costs (including overruns) of the PSC in year t
OMt = Operation and maintenance costs of the PSC in year t
RRt = Renewal and replacement costs of the PSC in year t
ARt = Adjustments for risk in year t
ACNt = Adjustments for competitive neutrality in year t
ASEt =Adjustments for differences in socio-economic consequences of the project in year t
Finally, in order to test the robustness of the Value for Money exercise as well as the Value for Money’s level of sensitivity to some of the assumptions considered, a sensitivity analysis should be made.
The assumptions to be modified in the sensitivity analysis may be related to PSC cost projections, cost overruns, income generated, the discount rate used in NPV calculations, and so on. The variation levels must be reasonable, in accordance with the experience of the analysts.
It should be noted that, typically, the quantitative VfM assessment is very much based on unproven assumptions. Not only the valuation of risks and cost estimates, but also the adjustments made to PSC and the discount rate, are estimates with a considerable level of inaccuracy. This is why its conclusions should be read for reference only; they need to be accompanied by sensitivity analysis and the numerical recommendation should always be followed by a qualitative analysis. In other words:
- A positive Value for Money does not necessarily imply that a PPP route should be used; qualitative factors should be considered in the decision as well
- A negative Value for Money does not mean that a PPP route is worse than traditional procurement. Sensitivities of important inputs should be developed in order to test the robustness of the results.
Under these circumstances, the use of the VfM methodology as a scientific pass or fail test is highly criticized, which is why some countries choose not to use it altogether.
However, taken as a reference only, the tool is very useful to indicate the capacity of the PPP mechanism to increase efficiency in infrastructure delivery.
16.2.2 Qualitative VfM Analysis
Qualitative VfM assessment checks whether the general concept of the project fits the model of private sector investment. One issue that might be considered is the expertise the private sector might be able to contribute to the specific project. It is also relevant to investigate the effectiveness of mechanisms to reduce information asymmetry between the government and the private sector.
Non-financial benefits of PPPs should also be taken into account and presented in the qualitative analysis.
According to the European PPP Expertise Centre (EPEC)[54], “the incentives which are specific to PPP projects are specifically intended to deliver greater non-financial benefits than conventional procurements. Ignoring this issue could lead to an unwarranted bias against PPPs”.
In this sense, the EPEC points out that: “PPP may provide the private sector with broader opportunities to apply innovation at all levels of project delivery. These incentives, if effectively harnessed, can provide non-financial benefits through three key mechanisms:
- Accelerated delivery (delivering services earlier);
- Enhanced delivery (delivering services to a higher standard); ND
- Wider social impacts (greater benefits to society as a whole).”
In fact, some of these non-financial benefits might have been incorporated in the adjustments of the PSC mentioned above, and as such must not be “double counted”. Nevertheless, in case these factors are not quantified, they should be discussed in depth in the qualitative assessment.
All problems associated with involving a private sector player into the specific PPP contract should also be highlighted in the qualitative assessment, followed by the proposed strategy to mitigate them. These can be problems associated with the following.
- Lack of policy flexibility in the future due to the long-term contractual relationship, which is particularly relevant for dynamic policy sectors.
- Specific difficulties in monitoring private sector performance due to the technical limitations of the procuring agency and/or the nature of the service itself.
- The role of specific assets in the delivery of wider policy objectives and the potential difficulty to associate performance indicators with them.
Different countries have different approaches as to which type of criteria are used in a qualitative analysis. However, it is absolutely necessary that this assessment investigates the main quantified risks and issues, and tries to indicate potential problems that can be created if including the private sector as a service provider in the particular project.
Qualitative VfM analysis has the advantage over quantitative analysis of not relying on sometimes uncertain numerical assumptions. See box 4.16. However, qualitative analysis is inevitably subjective. Thus, the qualitative conclusions should, to the extent possible, be viewed alongside the quantitative analysis for a thorough comprehension of the advantages of the PPP contract over the traditional forms of procurement.
|
Box 4.16: Approaches to Qualitative VfM
Source: Value-for-Money Analysis – Practices and Challenges: How Governments Choose When to Use PPP to Deliver Public Infrastructure and Services. World Bank Group, PPIF, 2013, p. 21. |
[46] Many countries call this traditional procurement route Design-Bid-Build.
[47] This approach estimates the impact of events building upon a great number (commonly tens of thousands) of iterations based on previously inputted probabilities. This produces a distribution function of the possible outcomes (as well as other statistical results such as percentiles).
[48] Given the comparative nature of the VfM exercise, the risks allocated to the government in the PPP project do not need to be considered in the PSC because the risks would have to be considered in both competitive alternatives, and so disregarding them in both solutions is a simpler methodology.
[49] Construction delays may also have direct financial impacts to be considered in the VfM, such as a difference in tariff collection or an increase in construction costs.
[50] The main issues surrounding the discount rate have been introduced in chapter 2 in the context of Cost-Benefit Analysis (CBA). The rate of discount selected or the method used to calculate it in economic appraisal (cost-benefit) should not necessarily be consistent with the one applied in VfM, as CBA is conducted for different purposes and considers different cash flows from different perspectives.
[51] As stated in the Green Book: Appraisal and Evaluation in Central Government, the discount rate, in real terms, used in the UK is 3.5 percent.
[52] A broader discussion of different country approaches to the discount rate can be found in Value-for-Money Analysis Practices and Challenges: How Governments Choose When to Use PPP to Deliver Public Infrastructure and Services. World Bank Group, Public-Private Infrastructure Advisory Facility (PPIAF), 2013.
[54] The European PPP Expertise Centre (EPEC) is a joint initiative of the European Investment Bank (EIB), the European Commission and European Union Member States and Candidate Countries, created to strengthen the capacity of its public sector members to enter into Public Private Partnership (PPP) transactions.
Add a comment